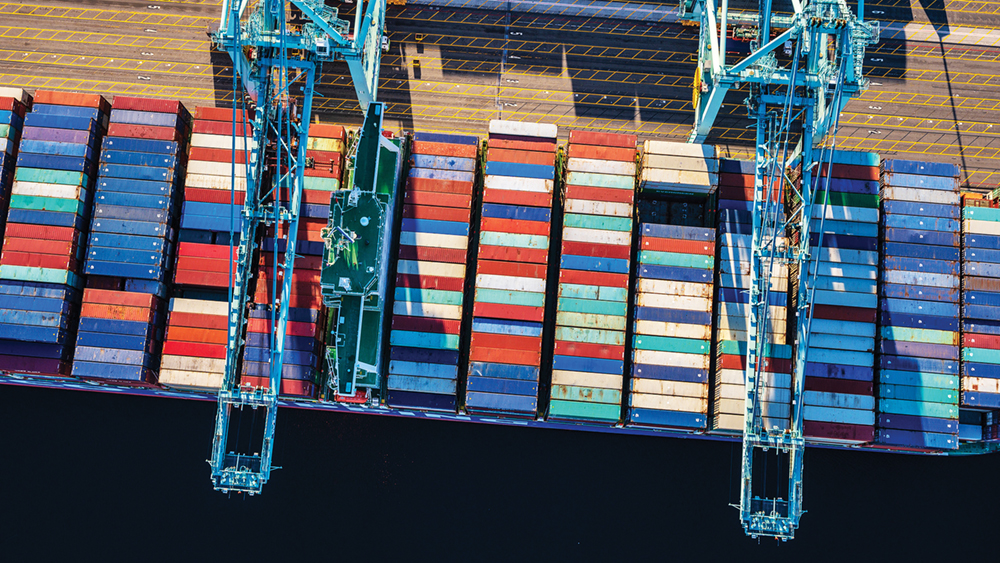
The seaports in Los Angeles, Long Beach, California and Vancouver, British Columbia may be the biggest and busiest in North America, but they’re also least efficient, according to a newly-released white paper.
The latest annual Container Port Performance Index, or CPPI, which was compiled by the World Bank Group and S&P Global Market Intelligence, found that among the top 370 ports globally, LA, Long Beach and Vancouver, BC rank in the bottom three.
Poorly performing ports, according to the performance index, are characterized by limitations in spatial and operating efficiency, limitations in maritime and landside access, inadequate oversight, and poor coordination between the public agencies involved, resulting in a lack of predictability and reliability.
Efficient performance encompasses a myriad factors, according to the performance index, including the efficiency of the port itself; the availability of sufficient draught, quay and dock facilities; the quality of the connections to road and rail services; the competitiveness of those services; and the efficacy of the procedures employed by the public agencies involved in container clearance.
Inefficiencies or nontariff barriers in any of these actors can result in higher costs, reduced competitiveness and lower trade.
“How a maritime port performs is a crucial element in the cost of international trade for a country,” the CPPI’s executive summary states. “Unfortunately, ports and terminals, particularly for containers, can often be sources of shipment delays, supply chain disruptions, additional costs, and reduced competitiveness.”
“Poor performance can also have an impact far beyond the hinterland of a port: container shipping services are operated on fixed schedules with vessel turnaround at each of the ports of call on the route planned within the allocated time for port stay,” the summary continues. “Poor performance at one port on the route could disrupt the entire schedule.”
“The result far too often, is that instead of facilitating trade, the port increases the cost of imports and exports, reduces the competitiveness of its host country and its hinterland and inhibits economic growth and poverty reduction,” the summary states.
LA, Long Beach and Vancouver, BC are the only West Coast ports in the bottom 10 of the performance index. Just outside the bottom 10 however, is the Port of Oakland, which is California’s third-busiest port and the fourth-busiest in North America, according to volume data.
The Seattle and Tacoma seaports also ranked in the 300s on the performance index. The top three ranking ports in the study were all in Arabian countries: King Abdullah Port in Saudi Arabia,
the Port of Salalah in Oman and Hamad Port in Qatar. The highest-ranking U.S. port overall was the Port of Virginia at number 23.
But despite being listed at the bottom for efficiency by the CPPI, LA and Long Beach remain the two busiest seaports on the continent. In 2021, the Port of Los Angeles moved a total of 10.67 million 20-foot equivalent unit containers (TEUs), which was about a 15.6% increase from the previous calendar year.
“Decades of development provided the berth space, backland and rail infrastructure to process more cargo than ever before,” POLA Executive Director Gene Seroka said of the numbers during his annual State of the Port Address in January.
Long Beach also set an annual cargo record last year, moving 9.3 million TEUs.
“This incredible milestone was achieved by the skilled workers who keep goods moving through the supply chain as we continue to seek solutions to improve efficiency, attract business and build for the future,” Port of Long Beach Executive Director Mario Cordero said in a statement when the numbers were announced in January.
“I look forward to enhancing productivity in 2022 by advancing our move toward 24-7 terminal operations, deploying data-sharing technologies for our industry partners, and continuing our infrastructure improvements,” he added.
The record numbers for both ports came despite ongoing congestion and amid the coronavirus pandemic, which has plagued the goods movement industry.
Congestion relief became a point of focus for the adjoining ports last fall when, in conjunction with the Biden Administration, they announced a fee that would charge ocean carriers on every import lingering at the seaports.
Their proposed Container Dwell Fee, which was announced last October, calls for ocean carriers $100 for every container that stays at terminal for nine or more days, rising in $100 daily increments per container until the container departs the terminal.
Any revenue from the fees would go to programs that would improve cargo efficiency and velocity.
However, the ports have repeatedly delayed implementing the fee due to seeing a steady a decrease in congestion week by week since announcing the fee policy. As of June, the ports have said that they’ve seen a combined 40% decline in the amount of imports staying past their allotted time on the docks since the fee’s announcement.
Regarding the CPPI, the World Bank-S&P Global Market Intelligence team has said that it plans to continue to refine the methodologies; the scope, where possible increasing the number of ports, and the data.
“Looking to the future, the intention is that the CPPI will evolve and be enhanced in subsequent editions, reflecting refinement, stakeholder feedback, and improvement in data scope and quality,” the document’s executive summary states. “The overall objective remains the identification of potential improvement to ultimately benefit all public and private stakeholders, including ports, shipping lines, governments, line agencies, businesses and consumers.”
The full CPPI can be found on the World Bank’s website, worldbank.org.
